
Wine Basics
Wine Investing
Apr 24, 2025
Introduction to Wine Investing: How To Understand The State of the Overall Wine Market.
To invest in anything, the very very very bare minimum knowledge threshold required is the value of what you’re buying, and how it has performed in the past.
In this edition of The Wine Investing Newsletter, I will be addressing the second point. How do we understand how wine has performed as an asset?
How do I measure how wine markets have performed?
The Liv-ex
The industry benchmarks are typically the Liv-ex indices – in the same way traditional equities have the S&P500 and the FTSE100 etc..
The Liv-ex describe themselves as “the global exchange for the wine trade” – which is pretty much fair enough if you’re looking at ‘trade only’ exchanges. There are some other notable exchanges which are accessible by the general public.
If you’re thinking of investing in wine, then it’s likely that these indices will be one of the first places you go to understand what the market is doing.
For the uninitiated, the Liv-ex effectively act as a ‘stock market for wine’. Only trade members are allowed access and users can place bids and offers on different wines.
The Liv-ex publish a number of indices, the exact weighting / construction of which is not publicly available, but we can infer that they use the ‘mid price’ (more on that in a future newsletter), of the most traded (also one to dig into, value or volume?) wines on the market for each given bracket.
The Liv-ex 100 and 1000 are the ‘most traded’ 100 and 1000 wines on the market. The Bordeaux 500 are the 500 most traded wines from Bordeaux on the market and so on and so forth.
The Liv-ex 1000 “comprises seven sub-indices which represent the most traded wines from regions around the world: the Bordeaux 500, the Bordeaux Legends 40, the Burgundy 150, the Champagne 50, the Rhone 100, the Italy 100 and the Rest of the World 60.”

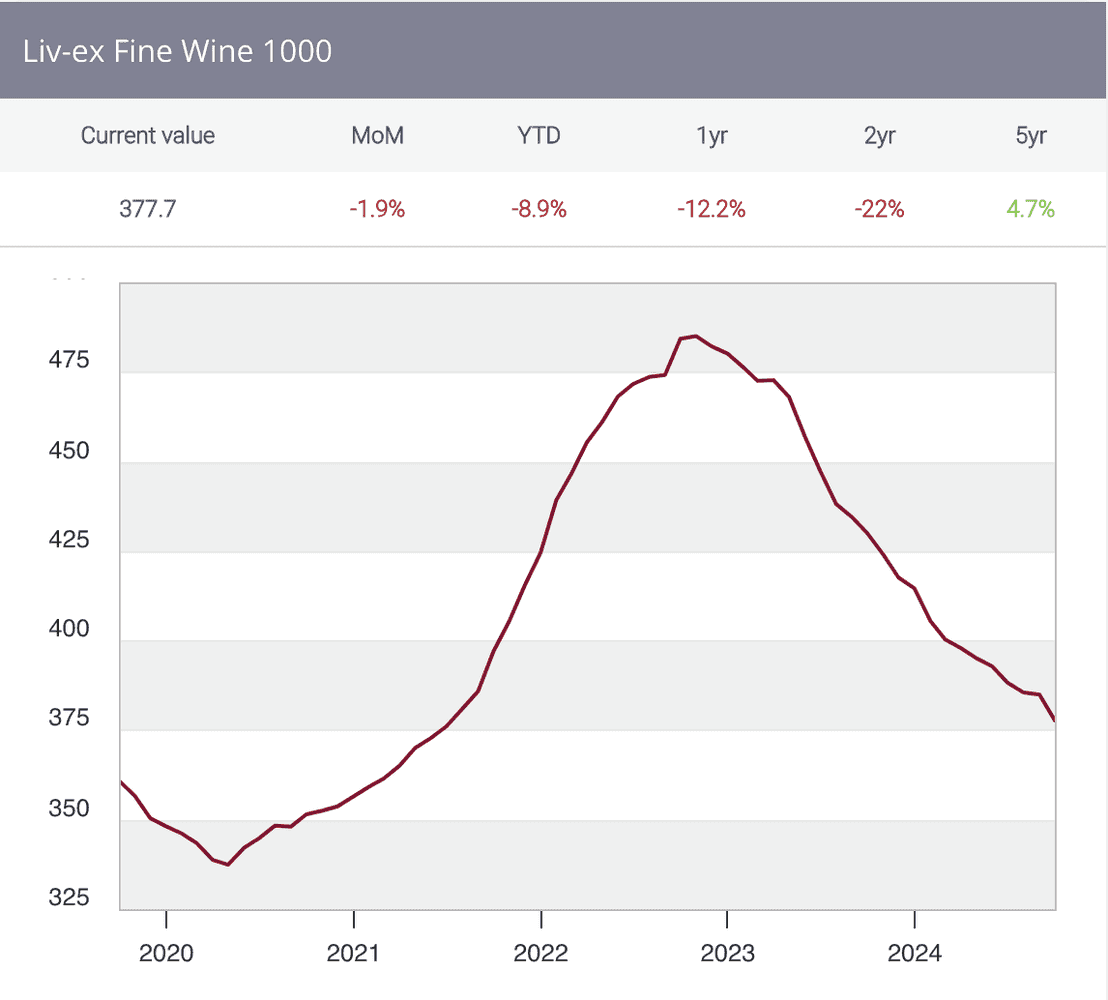
The Liv-ex 1000, taken from
The Liv-ex are rightly incentivised to provide the most efficient measure of the market. They want to provide investors price changes for the wines that are traded the most, because the prices of those wines are the most accurate.
The most highly traded wines however, are not necessarily the highest returning. The Liv-ex 100 and Liv-ex 1000 are both heavily weighted towards Bordeaux which has underperformed since 2011. For example, there are 540 Bordeaux vintages in the Liv-ex 1000
WineFi
At WineFi we are incentivised to identify the wines with the most potential to appreciate, and we want to include those wines in any market measuring that we do.
This translates to a broader approach when measuring the market.
We want to include every wine price that we can confirm is accurate. This means that we input as much data as possible, clean it (sorry Aaran Daniel) to make sure the prices are an accurate reflection, and translate it.
The WineFi Index therefore does not set an upper bounds on the number of wines that can be included. We instead set criteria that must be met for a wine to be included.

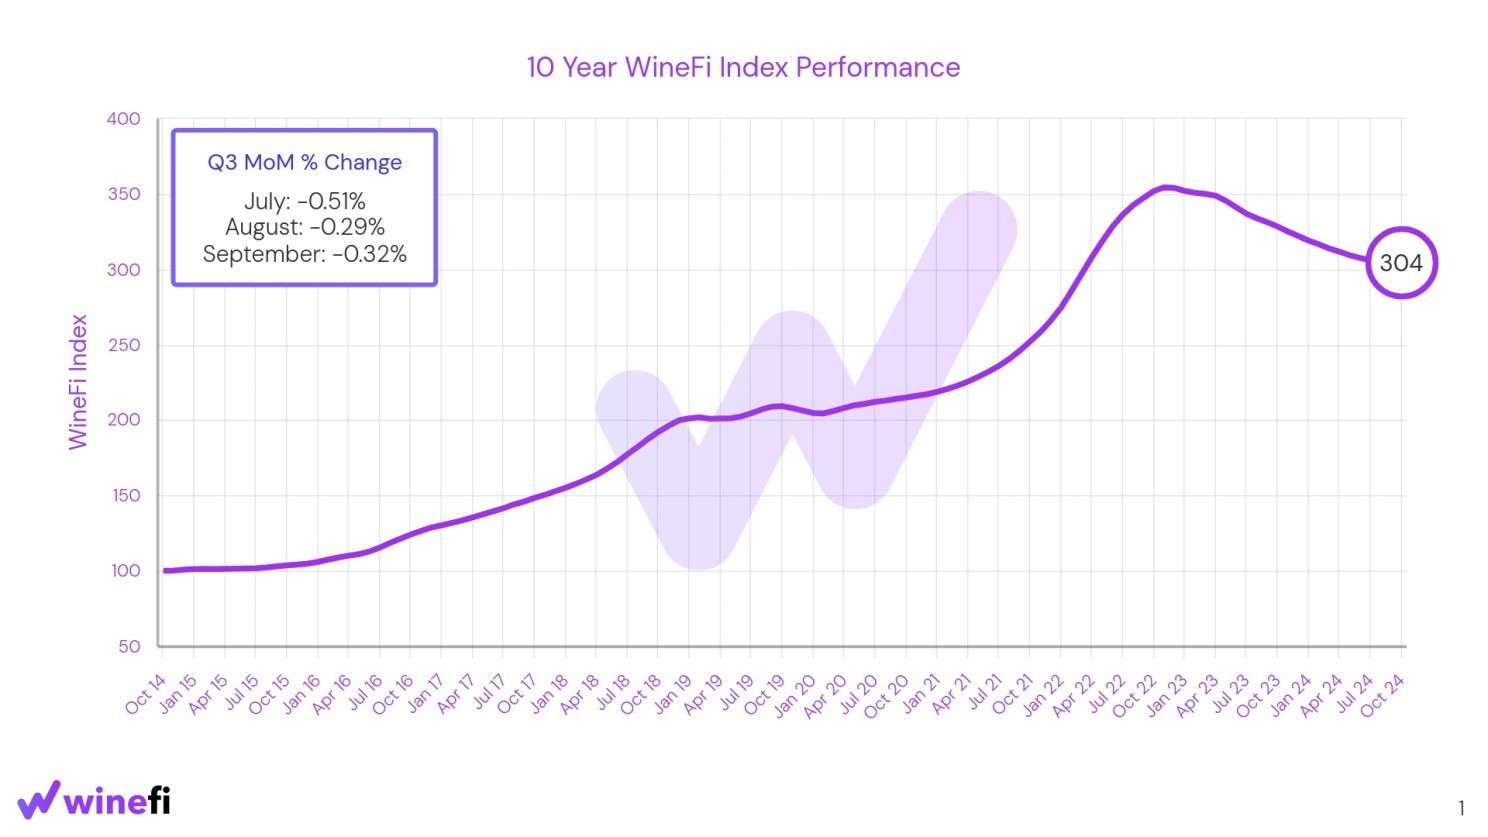
10 Year WineFi Index Performance
A wine qualifies if it:
Meets our minimum liquidity criteria; the label has sufficient current market depth based on visible offer depth at a trusted stock-holding merchant.
Is priced above £80/bottle or equivalent inflation-adjusted historical price.
is vintage 1968 or later
Regional weightings are based on Market Share by Trade Value according to the Liv-ex. The highest-priced wines are prioritised for selection in the index first. The indices are calculated on a price-weighted basis.
This means that wines with lower trade volume are included, and so we can capture a greater number of investment grade wines when measuring, and analysing market performance.
The idea is that the index will include wines that are less traded, but perform in a different manner to the Liv-ex indices. This allows us to identify regions, sub-regions, labels, and vintages that out(and under)-perform the markets.
On a wine by wine level
At WineFi, we have tools to understand the characteristics of a specific vintage of a specific label over the last X period. See below for a behind the scenes look at AskAaran (named that way because Aaran, our Head of Data wanted us to stop bothering him for wine performance charts).

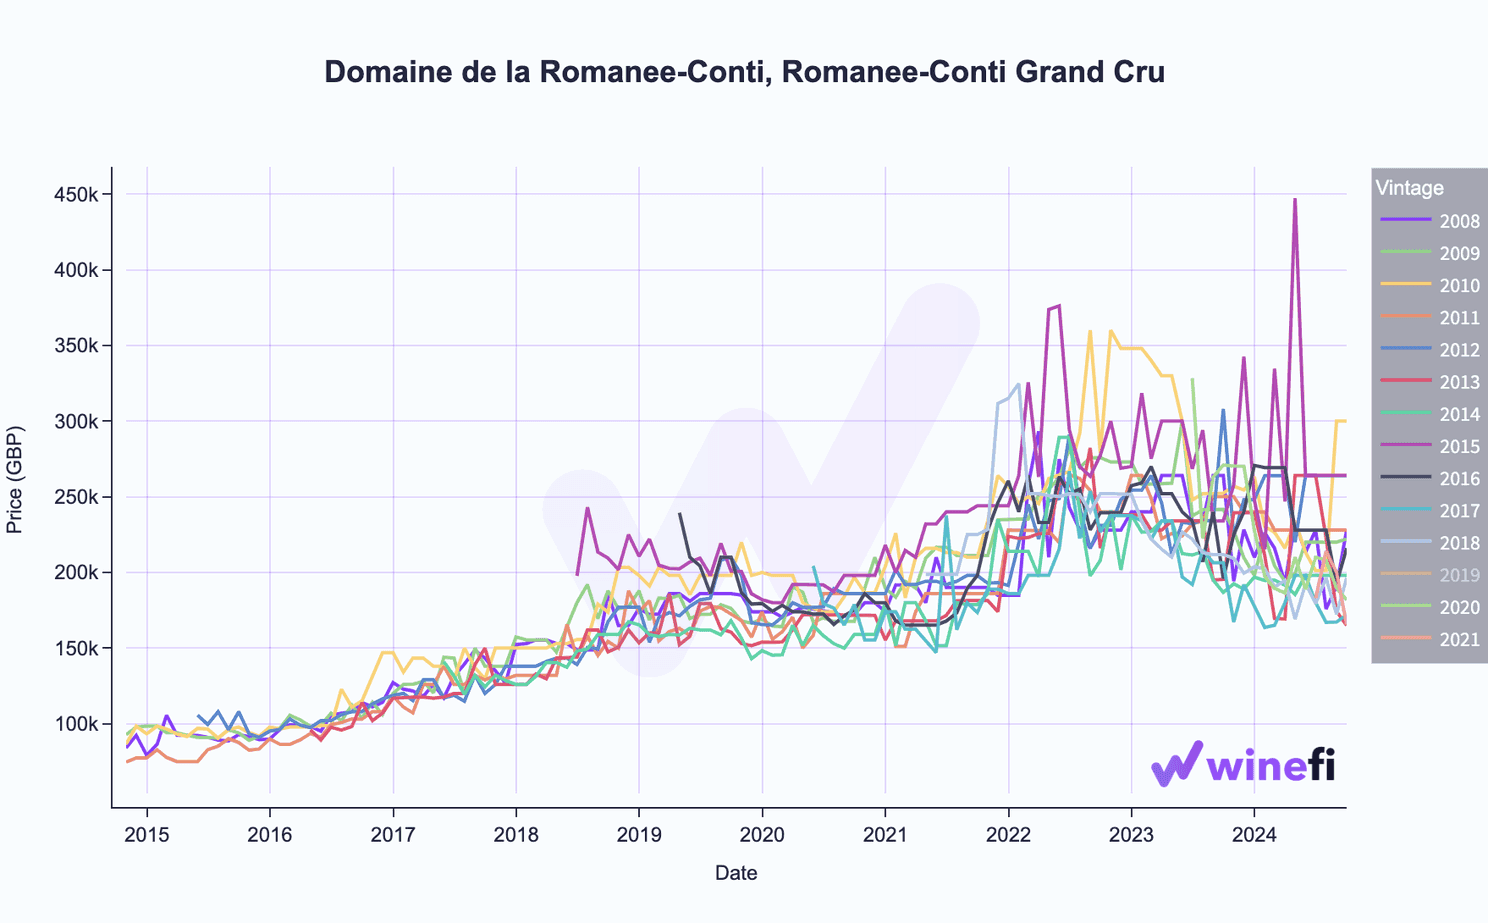
Ask Aaran – DRC Romanée Conti Vintage Performance
To someone getting started, WineSearcher is a good place to start. If you want to know how the 2009 DRC Romanée Conti has performed recently then the analytics page is a good place to go.

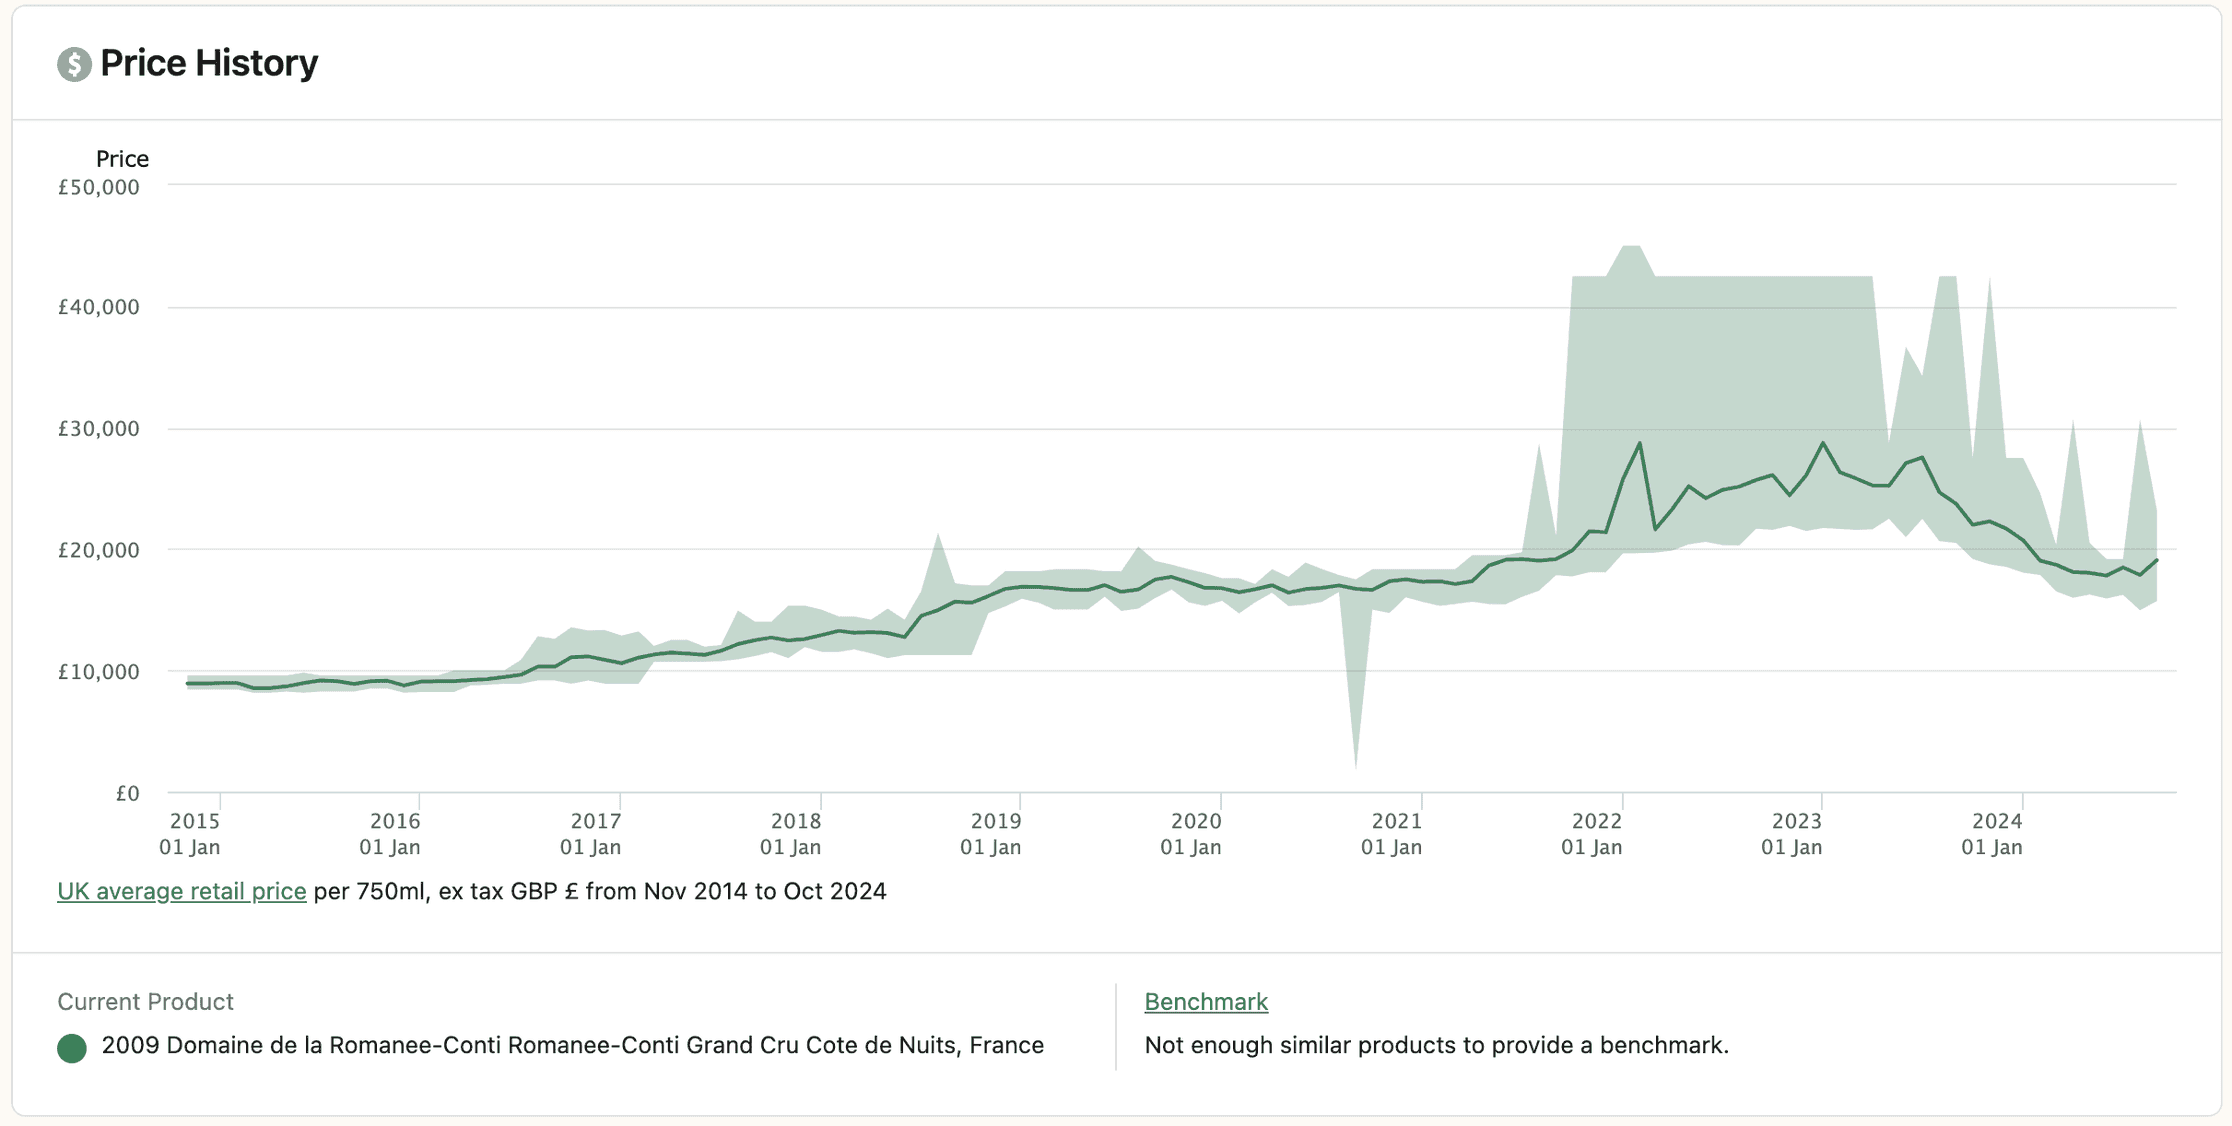
Credit to WineSearcher
There are a whole host of other metrics to look at when analysing on a wine by wine level, which will be the focus of a future newsletter.
Conclusion
All of the measures stated will give you a sense of how the wine markets are performing, and they will (likely) paint a similar picture.
The key distinction is that the Liv-ex indices will provide the most accurate snapshot of the most traded wines in the market. If you only plan to invest in the most traded wines then these will accurately reflect how your portfolio may have acted over the past year.
The WineFi indices provide a broader picture of how the markets are doing as a whole, but will include wines with less secondary market activity, and potentially less liquidity.
As a very basic piece of analysis – if the WineFi Index outperforms the Liv-ex 1000 (which it has over the past 10 years), then it is likely that the most-traded wines are not the ones that are outperforming the market, and vice versa.
If you’re thinking about investing in wine and you want to understand how the market is doing, both measures are important to get a proper grasp on market performance and to have the best idea you will likely want to take a look at both, and much more!
Enjoyed the article? Spread the news!
Read More

Producer
Wine Basics
Sep 25, 2025
Producer Spotlight: Domaine Paul Pillot
Investing in Domaine Paul Pillot
Overview

Producer
Wine Basics
Sep 25, 2025
Producer Spotlight: Cedric Bouchard
Investing in Cedric Bouchard
Overview

Wine Investing
Sep 18, 2025
Achieving Optimal Diversification
Introduction
This report will detail examples of a regionally diversified fine wine portfolios at capital allocations of £25,000, £100,000 and £310,000.
The wine market current is towards the tail end of a significant correction with many labelling it a “buyers market”, some signals suggest we are close to a bottoming out of prices.
This report details three example portfolios. Each portfolio is comprised of wine labels and producers with a proven track record of appreciation and secondary market liquidity. The portfolios are optimally diversified regionally and on a price basis for their respective capital allocations.
When it comes to sourcing - exact purchases will be dependent on market availability at the time of purchase.

Analysing historic performance of a portfolio composed of the above, annualised returns over a 5 year investment outlook range from 8% to 20% - depending on market conditions.
Note: For ease of calculation the example portfolios only include 75cl bottle formats. In reality we would look to invest a minority proportion of portfolios in larger format bottles, especially for larger portfolios sizes.

Portfolio 1 — £25,000
Regions covered: 4 | Producers per region: 2 - 5 |
Vintages per label: 1 | Labels per region: 2 - 5 |

Overview:
Some regional diversification and price diversification.
Includes smaller case sizes and single bottles only.
Inability to invest in cases of more expensive wines without committing a large proportion of the portfolio to a single vintage of a single label.
Inability to include multiple top tier labels from Burgundy, Champagne or Bordeaux.
No vintage diversification within a wine label or producer without sacrificing diversification in other areas.

Portfolio 2 — £100,000
Regions covered: 7 | Producers per region: 3 - 9 |
Vintages per label: 1 - 2 | Labels per region: 3 - 9 |

Overview:
Regional diversification: Covers all major fine wine investment regions in good proportions.
Label diversification: label diversification within regions but none within a given producer, which can be particularly important for Burgundy.
Larger case sizes: a good proportion of larger case sizes included.
Vintage diversification: limited to no vintage diversification within wine labels and producers.
Some trade-off between label diversification and vintage diversification.
At this portfolio size decisions need to be made between holding multiple vintages of a strong label or one vintage of multiple strong labels.
Smaller allocation of highest value blue-chip wines than would ideally be desirable.

Portfolio 3 — £310,000
Regions covered: 7 | Producers per region: 5 - 11 |
Vintages per label: 1 - 3 | Labels per region: 5 - 15 |

Overview:
Regional diversification: All top investment grade regions are covered in splits we believe to be optimal for 13.5% historic annualised returns.
Label diversification: multiple labels per region and in some cases multiple labels per producer (Leroy, DRC, Armand Rousseau).
Vintage diversification: multiple vintages per wine label which manages the risk of a single vintage underperforming;
Includes larger case sizes: larger and rarer case sizes are often a better store of value, command a premium and are considered more desirable on the secondary market.
Ideal price split based on analysis of historic returns.

£310,000+
Beyond the £310,000 mark, additional advantages include:
Ability to allocate some portfolio to more left-field European investment regions — Loire, Rioja and Mosel — and so called up-and-coming New World regions — South Africa, Argentina, Chile and South Australia.
Increased ability to diversify across vintages within a given label.
Increased ability to diversify across case and bottle formats.
Access to more rare wines, cases and bottle formats allowing diversification across the top blue chip wines.
Exposure to true collectible items that are hard to find and often past drinking age, older Bordeaux and Burgundy i.e.1945 Mouton Rothschild.

Appendix
Smaller portfolios limit:
Ability to diversify by region.
Regions tend to have periods of dominance, they can go out of fashion and can require reinvention. Bordeaux for example currently experiencing this. A portfolio diversified by region manages risk of regional trends shifting.
Regions represent different risk profiles. Tuscany for example has grown very consistently over the last 20 years and has been the region most resistant to the recent market downturn but is less likely to shoot the lights out in terms of returns. This is evidenced by the narrower distribution of returns below:
Champagne sits somewhere between Tuscany or Burgundy, with the high average returns closer to Burgundy, but relatively consistent growth over the last 22 years and across wine labels.
Bordeaux has proven itself to be the most cyclical region, likely due to it being the most financialised and the ability of en primeur releases to define market sentiment. From 2003 to 2011 Bordeaux saw impressive returns but has since floundered somewhat.
Ability to diversify by price range.
Different price ranges represent differing risk profiles. Over the last 7 years, wines below £9,600 (12x75cl case price) had higher proportion of wines averaging CAGR over 25% than those above.
The very highest returning wines are often instances of new wines breaking into the mainstream investment-grade wine consciousness. Such as Domaine Arnoux Lachaux, whose wines 10x in price over a few short years. These are often wines that start a in the lower investment-grade price brackets below £9600 per case.
More consistently high and predictable returns however, are to be found at higher price ranges £9,600 - 19,200, with names like DRC. These wines are very unlikely to 10x in price but have demonstrated consistently strong returns across all vintages for some time now.
Access to the rarest most expensive wines.
We have modelled portfolios using historical price data to find optimal portfolio returns based on wine price brackets:
Look-back period
Optimal Price Range (12x75cl Case)
5 years
£15,600 - £18,000
7 years
£13,200 - £18,000
10 years
£8,400 - £13,200
At these prices - assuming we purchase 6-bottle case - a £25,000 portfolio could only consist of 3-6 vintages.
Breakdown of returns by price bracket (including all liquid investment grade wines):
2017 Price Range (£)
Avg. 7yr CAGR (%)
Avg. Lifetime CAGR (%)
Cross-vintage Standard Deviation (%)
9601-19200
13.61
13.99
7.14
19201+
11.48
12.9
7.51
4801-9600
10.08
10.69
9.43
1201-2400
8.01
8.22
7.8
2401-4800
8.31
8.68
8.35
1200 and less
7.15
6.79
7.34
Limited vintage diversification
Smaller, less diversified portfolios have increased exposure to:
Changing critic scores of a given vintage;
Vintages ageing in an unexpected manner;
Risk of producers releasing “held back” stock for a given vintage.
Limited ability to purchase larger cases and bottle formats
A small portfolio size often forces us to invest in small case sizes which, tend to be more common and have less chance of selling for a rarity premium upon exit. We find that this is particularly true of older and more expensive wines.
Summary
As the total investment amount increases, investors can build more diversified portfolios with wines from multiple regions and from a wider range of top producers.
Including multiple vintages of key wines, manages the risk of a single vintage underperforming;
Pricing diversification allows for a balance between established blue-chip wines and “up-and-comers”;
Larger portfolios can diversify whilst also accessing the most prestigious wines, in rarer formats or cases sizes.
With smaller portfolio amounts we would try to focus on smaller case sizes and there would be a trade-off between regional diversification and ability to include a range of elite blue-chip wines.
WineFi Investment Score (WIS) & CAGR Expectations
Internally we use historical price data to rank wine producers, labels and vintages with a WineFi Investment Score (WIS). The WIS score is based on proprietary modelling of wine prices and attributes from 25+ years of pricing data.
The system evaluates a wide range of factors—such as historical price trends, critic scores, brand reputation, vintage reputation, regional characteristics and market conditions—to identify wines that are currently under-valued and most likely to outperform average market returns.
It relies on two main models:
An Efficient Market Price Model, which finds wines that appear underpriced or overpriced compared to their “fair” market value.
A Returns Ranking Model, which estimates the likelihood of each wine’s price rising over the next four years.
The WineFi Investment Score (WIS), when tested on historical data has proven to highlight assets which deliver above-average returns. In practice, these models can be used:
To “pick stocks” in the wine market ensuring portfolios are positioned for the strongest growth potential.
To actively manage portfolios monitoring when wines are overvalued signalling a good time to consider an exit.
This process allows us to “stock pick” and isolate the wines that are most likely to achieve abnormal returns above the market. We would expect a diversified portfolio of £200,000 - £400,000 to achieve 13.5% CAGR over a 5-7 year investment outlook.